Introduction:
The kilometre registration app Thrivey easily records your travelled kilometres and also helps users to measure their carbon dioxide equivalent, or CO2 emissions. In this blog we will show you how Thrivey calculates the CO2 value for each means of transportation. While researching the CO2 emissions of various means of transportation, we came across some astonishing figures. At the end of the blog, we will discuss our findings.
How are CO2 emissions calculated?
We want to be able to compare the emissions of the various means of transportation with each other so as to provide you with meaningful insights about your own CO2 footprint, to help you make better informed decisions about how you want to organize your trips. The calculations are based on averages and are conducted in the same way for all means of transportation. It goes without saying that the CO2 emissions of an older jeep will be greater than those of a newer smaller car. We have chosen to calculate the CO2 emissions for cars based on an average car.
The calculations include the manufacturing and use of means of transportation. The largest CO2 emissions of the various means of transportation occur at different stages of their respective life cycles. For example, the most important CO2 emissions of an average petrol car appear in the use of the car. This is called Tank To Wheel. But for an electric car, the largest emissions actually occur during the manufacturing stages and during the generation of electricity: Well To Tank. Because different means of transportation have different numbers of passengers, their CO2 emissions are calculated in grams of CO2 per passenger-kilometre.
For the CO2 emissions of aircraft, we take into account two additional variables. CO2 emitted at a higher altitude has a greater negative impact on the greenhouse effect than CO2 emitted lower to the ground. In addition, aircraft cause condensation trails and are partly responsible for the formation of cirrus clouds. Both factors contribute to global warming. What we have not taken into account is the production and maintenance of the infrastructure required for all means of transportation such as roads, railways and airports. For more athletic means of transportation, such as walking and cycling, travellers will use extra energy in the form of food consumption. We have not included these extra CO2 emissions for the trips, but it is interesting to note that your diet can be a factor in the size of your CO2 footprint.
How much CO2 do the different means of transportation emit?
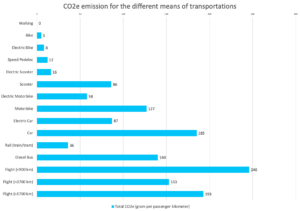
The interesting things we have noticed:
Through our research, we stumbled upon two questions:
Why does a diesel bus emit such a large quantity of CO2?
Based on the graph above, you can see that a regular bus or city bus (this is a diesel bus) emits more CO2 than an electric car, a motorcycle or a scooter. Taking a bus therefore isn’t always the greener option than riding a scooter! In our research we have found out that there are two important reasons for the unexpected high CO2 emissions of a (diesel) bus. Firstly, the production of the bus causes a lot of CO2 emission. Secondly, the average occupancy rate of the bus is often low, meaning: the bus is not always full. The bus does not use its maximum capacity, and therefore the number of grams of CO2 per passenger kilometre is relatively high.
Why do long-haul flights have higher CO2 emissions per passenger kilometre than medium-haul flights?
Most CO2 is emitted from aircraft during the take-off and landing phase. For a long-haul flight, the take-off and landing is a relatively smaller part of the journey than that of a short-haul flight. That is why short flights have higher CO2 emissions per passenger kilometre.We were surprised to find out that medium-haul flights have lower CO2 emissions than long-haul flights. This is because the CO2 per passenger is calculated for the space that a passenger occupies in an aircraft. Business class passengers take up much more space in a plane than economy class passengers and therefore emit more CO2. On long-haul flights, on average, more people fly in business class. And together they emit on average more CO2 per passenger kilometre in long-haul flights than in medium-haul flights. If you only look at economy class passengers, the CO2 emissions per passenger kilometre are lower when they take a long-haul flight than the emissions when they take a medium-haul flight.
References:
- Greenhouse gas reporting: conversion factors 2021 https://www.gov.uk/government/publications/greenhouse-gas-reporting-conversion-factors-2021
- Seb Stott (October 30, 2020) How green is cycling? Riding, walking, ebikes and driving ranked https://www.bikeradar.com/features/long-reads2/cycling-environmental-impact/
- Zeke Hausefather (May 13, 2019) Factcheck: How electric vehicles help to tackle climate change https://www.carbonbrief.org/factcheck-how-electric-vehicles-help-to-tackle-climate-change
- Cascade Collision: Understanding the Average Lifespan of a Car (8 October, 2020) https://cascadecollision.com/blog/what-is-the-average-life-of-a-car/
- Hernandez, M., Kockelman, K. M., Lentz, J. O., & Lee, J. (2019). Emissions and noise mitigation through use of electric motorcycles. Transportation Safety and Environment, 1(2), 164-175.
- Päivi Kärnä (2012) Carbon footprint of the raw materials of an urban transit bus: case study: diesel, hybrid, electric and converted electric bus. https://www.researchgate.net/publication/263429106_Carbon_footprint_of_the_raw_materials_of_an_urban_transit_bus_case_study_diesel_hybrid_electric_and_converted_electric_bus
- Christopher MacKechnie (2019) How Long Do Buses and Other Transit Vehicles Last? https://www.liveabout.com/buses-and-other-transit-lifetime-2798844